Tableau - Covid Exploration
In this project, we use Tableau to create a dashboard on Covid 19.
Welcome to my Data Analyst Portfolio.
My passion is to understand the intersection of data science and art...
In this project, we use Tableau to create a dashboard on Covid 19.
In this project, we use Power BI to create a Sale Overview Dashboard.
In this project, we use SAP to create a dashboard showed about Economic and Tourism in Cambodia.
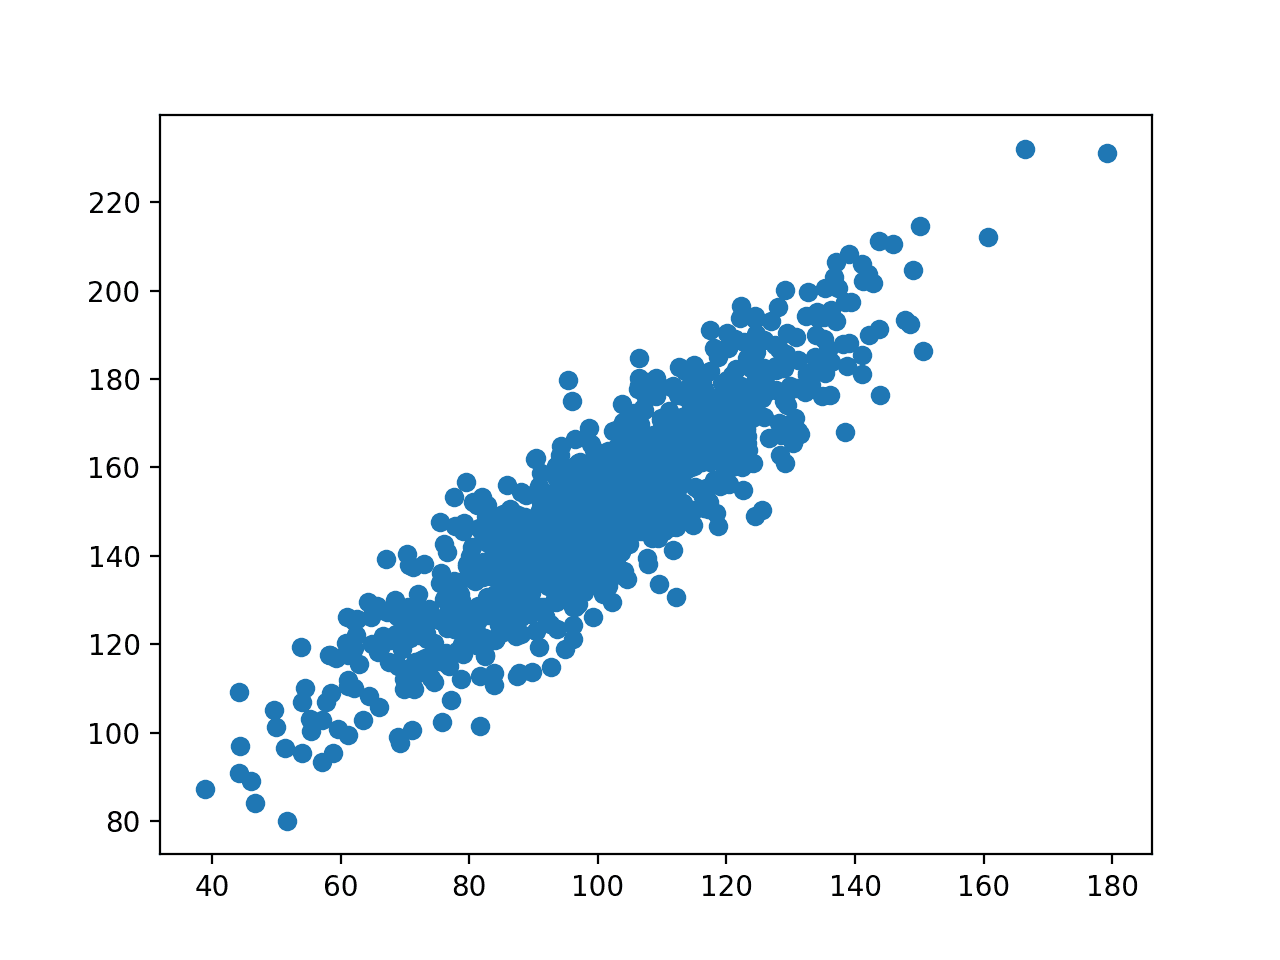
In this project, we use Pandas & Matplotlib to extract, clean and visualize data of the Movie Dataset.

In this project, we use BeautifulSoup to scrap the data from Amazon Web
I am a Data Analyst. These are all the skills I have.
One of the most common uses for Python is in its ability to create and manage data structures quickly.
SQL ( Structured Query Language ) is Needed for Data Analyst to get the data and to work with that data.
Power Bi & Tableau, these tools include key features such as data visualization, visual analytics, interactive dashboarding and KPI scorecards.
Numpy and pandas are essential for analyzing data whereas matplotlib and seaborn lets you visualize your data
Microsoft Excel is one of the top tools for data analysis and the built-in pivot tables are arguably the most popular analytic tool.
Data cleaning is the process of fixing or removing incorrect, corrupted, incorrectly formatted, duplicate, or incomplete data within a dataset.
Stay updated with me. Let's be social.
I’d describe myself as being very resourceful and ambitious at the same time. I find solutions, get creative, and solve problems without needing the help of coworkersor managers. I know when to ask for help and I don’t stay quiet if I do need assistance. But when it is possible to handle something without occupying the time of others, I do it and I consider myself very good at it.