Tableau - Covid Exploration
Background
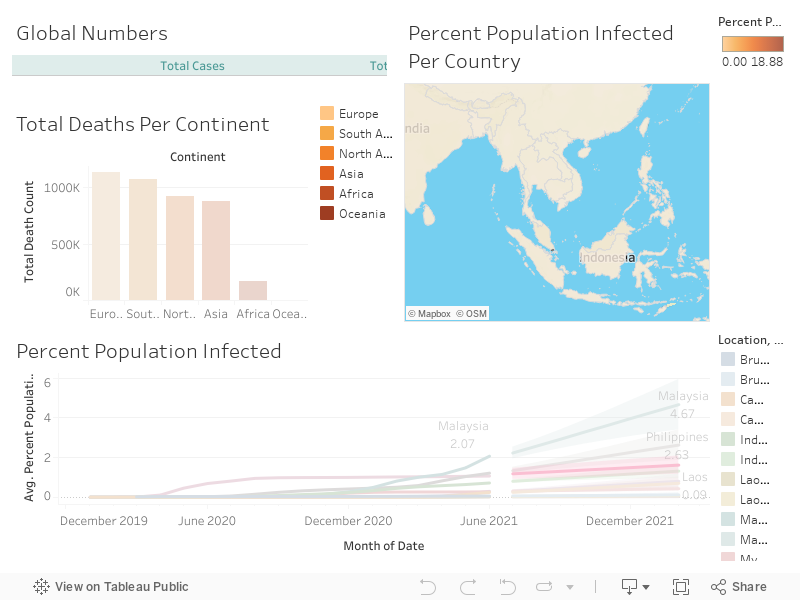
In recent year, COVID-19 has spread to many countries and infected many people. This Dashboard was designed to illustrate:
- Total number of cases, deaths, and death pecentage
- Column chart of total deaths per continent
- Line chart of percentage of infected population
- Geomap of percentage of infected population per country
SQL Code
/*
Heng Kimhak
Covid 19 Data Exploration
Skills used: Joins, CTE's, Temp Tables, Windows Functions, Aggregate Functions, Creating Views, Converting Data Types
*/

Select *
From PortfolioProject..Covid_Death$
Where continent is not null
order by 3,4


-- Select Data that we are going to be starting with

Select Location, date, total_cases, new_cases, total_deaths, population
From PortfolioProject..Covid_Death$
Where continent is not null
order by 1,2


-- Total Cases vs Total Deaths
-- Shows likelihood of dying if you contract covid in your country

Select Location, date, total_cases,total_deaths, (total_deaths/total_cases)*100 as DeathPercentage
From PortfolioProject..Covid_Death$
Where location like '%states%'
and continent is not null
order by 1,2


-- Total Cases vs Population
-- Shows what percentage of population infected with Covid

Select Location, date, Population, total_cases,  (total_cases/population)*100 as PercentPopulationInfected
From PortfolioProject..Covid_Death$
--Where location like '%states%'
order by 1,2


-- Countries with Highest Infection Rate compared to Population

Select Location, Population, MAX(total_cases) as HighestInfectionCount,  Max((total_cases/population))*100 as PercentPopulationInfected
From PortfolioProject..Covid_Death$
--Where location like '%states%'
Group by Location, Population
order by PercentPopulationInfected desc


-- Countries with Highest Death Count per Population

Select Location, MAX(cast(Total_deaths as int)) as TotalDeathCount
From PortfolioProject..Covid_Death$
--Where location like '%states%'
Where continent is not null
Group by Location
order by TotalDeathCount desc


-- BREAKING THINGS DOWN BY CONTINENT

-- Showing contintents with the highest death count per population

Select continent, MAX(cast(Total_deaths as int)) as TotalDeathCount
From PortfolioProject..Covid_Death$
--Where location like '%states%'
Where continent is not null
Group by continent
order by TotalDeathCount desc


-- GLOBAL NUMBERS

Select SUM(new_cases) as total_cases, SUM(cast(new_deaths as int)) as total_deaths, SUM(cast(new_deaths as int))/SUM(New_Cases)*100 as DeathPercentage
From PortfolioProject..Covid_Death$
--Where location like '%states%'
where continent is not null
--Group By date
order by 1,2


-- Total Population vs Vaccinations
-- Shows Percentage of Population that has recieved at least one Covid Vaccine

Select dea.continent, dea.location, dea.date, dea.population, vac.new_vaccinations
, SUM(CONVERT(int,vac.new_vaccinations)) OVER (Partition by dea.Location Order by dea.location, dea.Date) as RollingPeopleVaccinated
--, (RollingPeopleVaccinated/population)*100
From PortfolioProject..Covid_Death$ dea
Join PortfolioProject..Covid_Vaccination$ vac
On dea.location = vac.location
and dea.date = vac.date
where dea.continent is not null
order by 2,3


-- Using CTE to perform Calculation on Partition By in previous query

With PopvsVac (Continent, Location, Date, Population, New_Vaccinations, RollingPeopleVaccinated)
as
(
Select dea.continent, dea.location, dea.date, dea.population, vac.new_vaccinations
, SUM(CONVERT(int,vac.new_vaccinations)) OVER (Partition by dea.Location Order by dea.location, dea.Date) as RollingPeopleVaccinated
--, (RollingPeopleVaccinated/population)*100
From PortfolioProject..Covid_Death$ dea
Join PortfolioProject..Covid_Vaccination$ vac
On dea.location = vac.location
and dea.date = vac.date
where dea.continent is not null
--order by 2,3
)
Select *, (RollingPeopleVaccinated/Population)*100
From PopvsVac


-- Using Temp Table to perform Calculation on Partition By in previous query

DROP Table if exists #PercentPopulationVaccinated
Create Table #PercentPopulationVaccinated
(
Continent nvarchar(255),
Location nvarchar(255),
Date datetime,
Population numeric,
New_vaccinations numeric,
RollingPeopleVaccinated numeric
)

Insert into #PercentPopulationVaccinated
Select dea.continent, dea.location, dea.date, dea.population, vac.new_vaccinations
, SUM(CONVERT(int, vac.new_vaccinations)) OVER (Partition by dea.Location Order by dea.location, dea.Date) as RollingPeopleVaccinated
--, (RollingPeopleVaccinated/population)*100
From PortfolioProject..Covid_Death$ dea
Join PortfolioProject..Covid_Vaccination$ vac
On dea.location = vac.location
and dea.date = vac.date
--where dea.continent is not null
--order by 2,3

Select *, (RollingPeopleVaccinated/Population)*100
From #PercentPopulationVaccinated


-- Creating View to store data for later visualizations

Create View PercentPopulationVaccinated as
Select dea.continent, dea.location, dea.date, dea.population, vac.new_vaccinations
, SUM(CONVERT(int,vac.new_vaccinations)) OVER (Partition by dea.Location Order by dea.location, dea.Date) as RollingPeopleVaccinated
--, (RollingPeopleVaccinated/population)*100
From PortfolioProject..Covid_Death$ dea
Join PortfolioProject..Covid_Vaccination$ vac
On dea.location = vac.location
and dea.date = vac.date
where dea.continent is not null